|
The intent of this article is to discuss the relationship between
P/E ratios and subsequent annual returns for the
S&P 500 index.
P/E ratios may be the most used metric for stock valuations.
You may have heard that US stocks are currently trading at very high P/E ratios.
However, the impact on future returns is obscure.
At first glance, a high P/E looks bad: it means you have to pay a lot more for a stock relative to earnings.
Recent history clearly shows, however, that some of the best performing stocks trade at high P/Es, even shortly before their outperformance.
Forward-looking investors sniff out some of this future performance and willingly buy these stocks at high P/Es.
We want to know here if high S&P 500 P/Es have significant correlation with future returns, on average.
We’d also like to know to what extent these are good or bad.
We avoid speculation about the reasons for / against whatever the data says.
Data
To answer these questions, we use the S&P 500 total annual returns from 1928 to 2024, inclusive.
We also use an annual average of the S&P 500 trailing 12-month P/E
ratios from 1927 to 2023, inclusive.
We’ll look at the relationship between the P/E in these years with the annual return in the following year.
We exclude the P/E in 2009 (and hence the 2010 annual return) from this data as this P/E was “off the charts” at 83.6, and would extremely influence many conclusions.
We are left with 96 data points.
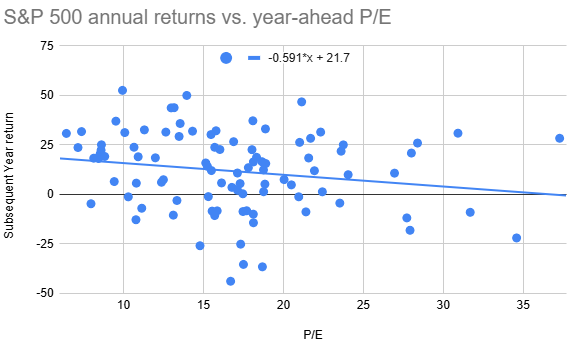
Below is a plot of S&P 500 annual returns versus P/E ratio from the prior year.
A best fit (minimum SSE) trendline is also included, which has a slope of about -0.6% per P/E.
We can immediately see that there’s quite a bit of scatter in the data.
P/E alone clearly won’t predict future annual returns—there’s much more going on.
However, let’s see if this trend of decreasing returns from higher P/Es is significant.
Statistics
Below are statistics computed from this data.
If you’re not familiar with the lingo don’t worry, the key points will be explained shortly.
Mean P/E and return: 16.8 and 11.8
Std. Dev P/E and return: 6.26 and 19.6
Correlation: -.188
Slope (b1): -0.59
Intercept (b0): 21.7
N: 96 data points
r^2: 0.036
T-statistic: -1.86
P-value (1-sided): 0.033
What do these statistics tell us?
The p-value of 3.3% indicates that the relationship is significant: there’s only a 3.3% chance we’d see this inverse relationship in the 96 data points if it weren’t real.
So, at least for the S&P 500 index, high P/E ratios are associated with lower future returns.
However, the r^2 value of just 0.036 indicates that this relationship is far from perfect.
This says only 3.6% of the variation in returns is explained by P/E.
That’s not much, and we could’ve guessed this would be small from the plot above.
What does this say for 2025 S&P 500 returns?
What can we say about expectations for 2025?
The fact that this P/E metric was 27.85 for 2024 means that, all else equal, we’d expect low returns in 2025.
In particular, the trendline predicts a 5.3% 2025 annual return from this P/E.
The problem, of course, is that we said “all else equal.”
Like it or not, we live in an extremely complicated world.
All else will not be equal.
As the r^2 statistic showed us, this metric only provides a sliver (3.6%) of insight into what will really happen.
In short, my conclusion from this is (1) it’s more likely than not we’ll have below average returns in 2025,
but (2) given the large uncertainty and the frictional fees (e.g. taxes) with trading, it’s not worth trying to trade around this.
Login to leave a comment.
Related Articles
Are annual return predictions useful?
2025 Investment Outlook
Active versus passive investing
Should you try to beat the market?
Click here for a list of other recent articles.
|