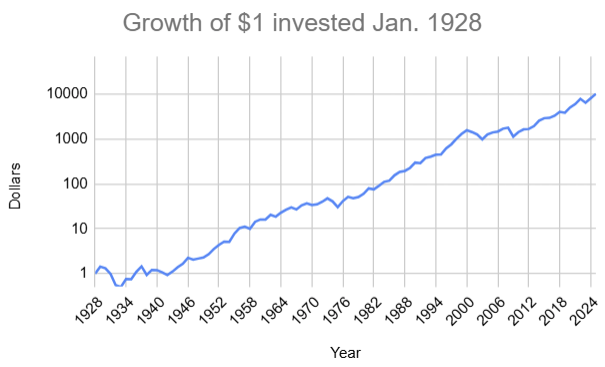
Summary
The S&P 500, sometimes just called the S&P, consists of 500 of the largest companies listed on US stock exchanges.
The S&P index measures the cap-weighted returns of the stocks in the S&P 500.
Funds that track this index have traditionally been highly recommended by the most prominent investors,
but this may be changing due to relatively higher valuations in the S&P.
On average, the value of this index has more than tripled every 10 years, including dividend reinvestment.
Other summary values are provided below, followed by a table of the historical yearly returns.
Dividends are included in all values.
For more information about the S&P 500 checkout Ed Yardini's book
S&P 500 Earnings, Valuation, and the Pandemic—
you should be able to get it for less than $8.
Entire history mean annual return: 11.8%
Entire history min/max annual return: -43.8%/52.6%
Last 25 years mean annual return: 9.4%
Last 10 years mean annual return: 14.5%
Last 5 years mean annual return: 16.5%
Table of total yearly returns of the S&P 500 (includes dividends)
| Year | Return [%] |
|---|
| 2024 | 25.02 |
| 2023 | 26.29 |
| 2022 | -18.11 |
| 2021 | 30.92 |
| 2020 | 18.40 |
| 2019 | 31.49 |
| 2018 | -4.38 |
| 2017 | 21.83 |
| 2016 | 11.96 |
| 2015 | 1.36 |
| 2014 | 13.52 |
| 2013 | 32.15 |
| 2012 | 15.89 |
| 2011 | 2.10 |
| 2010 | 14.82 |
| 2009 | 25.94 |
| 2008 | -36.55 |
| 2007 | 5.48 |
| 2006 | 15.61 |
| 2005 | 4.83 |
| 2004 | 10.74 |
| 2003 | 28.36 |
| 2002 | -21.97 |
| 2001 | -11.85 |
| 2000 | -9.03 |
| 1999 | 20.89 |
| 1998 | 28.34 |
| 1997 | 33.10 |
| 1996 | 22.68 |
| 1995 | 37.20 |
| 1994 | 1.33 |
| 1993 | 9.97 |
| 1992 | 7.49 |
| 1991 | 30.23 |
| 1990 | -3.06 |
| 1989 | 31.48 |
| 1988 | 16.54 |
| 1987 | 5.81 |
| 1986 | 18.49 |
| 1985 | 31.24 |
| 1984 | 6.15 |
| 1983 | 22.34 |
| 1982 | 20.42 |
| 1981 | -4.70 |
| 1980 | 31.74 |
| 1979 | 18.52 |
| 1978 | 6.51 |
| 1977 | -6.98 |
| 1976 | 23.83 |
| 1975 | 37.00 |
| 1974 | -25.90 |
| 1973 | -14.31 |
| 1972 | 18.76 |
| 1971 | 14.22 |
| 1970 | 3.56 |
| 1969 | -8.24 |
| 1968 | 10.81 |
| 1967 | 23.80 |
| 1966 | -9.97 |
| 1965 | 12.40 |
| 1964 | 16.42 |
| 1963 | 22.61 |
| 1962 | -8.81 |
| 1961 | 26.64 |
| 1960 | 0.34 |
| 1959 | 12.06 |
| 1958 | 43.72 |
| 1957 | -10.46 |
| 1956 | 7.44 |
| 1955 | 32.60 |
| 1954 | 52.56 |
| 1953 | -1.21 |
| 1952 | 18.15 |
| 1951 | 23.68 |
| 1950 | 30.81 |
| 1949 | 18.30 |
| 1948 | 5.70 |
| 1947 | 5.20 |
| 1946 | -8.43 |
| 1945 | 35.82 |
| 1944 | 19.03 |
| 1943 | 25.06 |
| 1942 | 19.17 |
| 1941 | -12.77 |
| 1940 | -10.67 |
| 1939 | -1.10 |
| 1938 | 29.28 |
| 1937 | -35.34 |
| 1936 | 31.94 |
| 1935 | 46.74 |
| 1934 | -1.19 |
| 1933 | 49.98 |
| 1932 | -8.64 |
| 1931 | -43.84 |
| 1930 | -25.12 |
| 1929 | -8.30 |
| 1928 | 43.81 |
|


|
Click here for other historical returns.
|