Summary
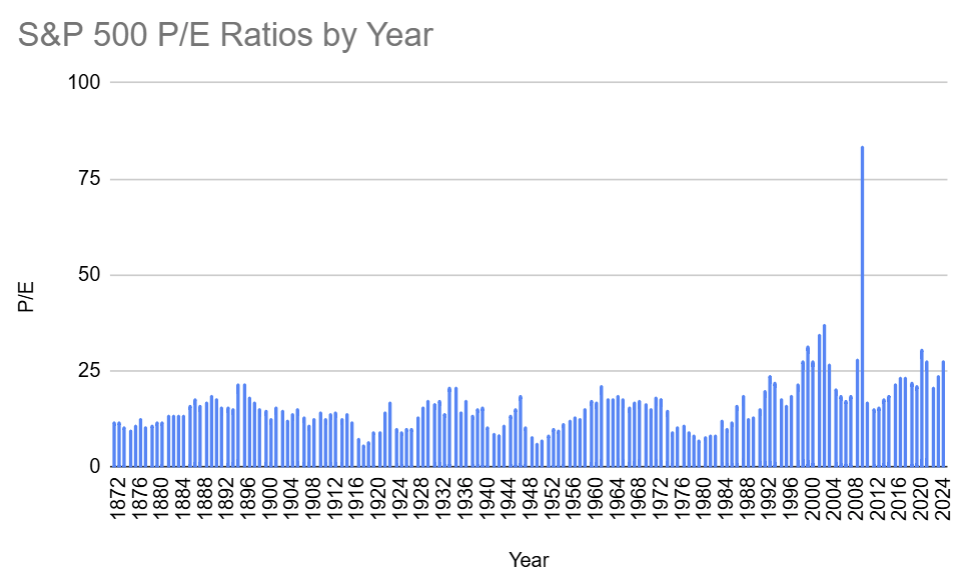
The table below includes price-to-earnings (P/E) ratios for the S&P 500 since 1871.
A single value is provided for each year—the mean of the trailing 12 month P/E throughout that year.
The P/E is the ratio of market cap to earnings. If Apple had a market cap of 2 trillion
USD and earned 100 billion USD last year, it's P/E would be 20 (2/.1).
This is equivalent to the share price divided by the earnings per share (EPS).
S&P 500 P/E ratios have historically had an inverse correlation to future annual returns:
a two point increase in P/E results in a 1%+ loss of annual return (on average).
For example, a "normal" P/E of 17 is associated with an 11.4% year-after annual return, while a
"high" P/E of 27 produces an expected annual return of just 5.7% (on average).
Notable values for these P/E ratios follow.
Historical mean (since 1871): 16.11
Historical median (since 1871): 15.28
Historical min/max: 6.08/83.60
Last 25 years mean: 25.72
Last 10 years mean: 24.44
Last 5 years mean: 26.29
Table of mean annual P/E ratios of the S&P 500
| Year | P/E |
|---|
| 2024 | 27.85 |
| 2023 | 23.75 |
| 2022 | 21.02 |
| 2021 | 27.92 |
| 2020 | 30.92 |
| 2019 | 21.58 |
| 2018 | 22.33 |
| 2017 | 23.53 |
| 2016 | 23.61 |
| 2015 | 21.94 |
| 2014 | 18.76 |
| 2013 | 17.81 |
| 2012 | 15.79 |
| 2011 | 15.14 |
| 2010 | 17.13 |
| 2009 | 83.60 |
| 2008 | 28.39 |
| 2007 | 18.69 |
| 2006 | 17.29 |
| 2005 | 18.90 |
| 2004 | 20.50 |
| 2003 | 26.95 |
| 2002 | 37.28 |
| 2001 | 34.59 |
| 2000 | 27.72 |
| 1999 | 31.69 |
| 1998 | 28.01 |
| 1997 | 21.70 |
| 1996 | 18.88 |
| 1995 | 16.03 |
| 1994 | 18.09 |
| 1993 | 22.44 |
| 1992 | 24.05 |
| 1991 | 20.05 |
| 1990 | 15.47 |
| 1989 | 13.34 |
| 1988 | 12.65 |
| 1987 | 18.66 |
| 1986 | 16.13 |
| 1985 | 11.99 |
| 1984 | 10.08 |
| 1983 | 12.38 |
| 1982 | 8.60 |
| 1981 | 8.54 |
| 1980 | 7.97 |
| 1979 | 7.38 |
| 1978 | 8.43 |
| 1977 | 9.42 |
| 1976 | 11.14 |
| 1975 | 10.66 |
| 1974 | 9.52 |
| 1973 | 14.79 |
| 1972 | 18.13 |
| 1971 | 18.32 |
| 1970 | 15.25 |
| 1969 | 16.78 |
| 1968 | 17.70 |
| 1967 | 17.13 |
| 1966 | 15.71 |
| 1965 | 18.12 |
| 1964 | 18.76 |
| 1963 | 18.13 |
| 1962 | 18.04 |
| 1961 | 21.41 |
| 1960 | 16.89 |
| 1959 | 17.46 |
| 1958 | 15.50 |
| 1957 | 12.98 |
| 1956 | 13.12 |
| 1955 | 12.50 |
| 1954 | 11.31 |
| 1953 | 9.94 |
| 1952 | 10.30 |
| 1951 | 8.44 |
| 1950 | 7.16 |
| 1949 | 6.43 |
| 1948 | 8.14 |
| 1947 | 10.80 |
| 1946 | 18.84 |
| 1945 | 15.54 |
| 1944 | 13.54 |
| 1943 | 10.92 |
| 1942 | 8.62 |
| 1941 | 8.83 |
| 1940 | 10.78 |
| 1939 | 15.71 |
| 1938 | 15.31 |
| 1937 | 13.48 |
| 1936 | 17.50 |
| 1935 | 14.32 |
| 1934 | 21.14 |
| 1933 | 20.96 |
| 1932 | 13.96 |
| 1931 | 17.47 |
| 1930 | 16.70 |
| 1929 | 17.33 |
| 1928 | 15.86 |
| 1927 | 13.17 |
| 1926 | 10.11 |
| 1925 | 10.13 |
| 1924 | 9.50 |
| 1923 | 10.26 |
| 1922 | 17.26 |
| 1921 | 14.31 |
| 1920 | 9.28 |
| 1919 | 9.18 |
| 1918 | 6.77 |
| 1917 | 6.08 |
| 1916 | 7.84 |
| 1915 | 11.73 |
| 1914 | 13.94 |
| 1913 | 12.85 |
| 1912 | 14.70 |
| 1911 | 14.15 |
| 1910 | 12.57 |
| 1909 | 14.36 |
| 1908 | 12.67 |
| 1907 | 11.07 |
| 1906 | 13.40 |
| 1905 | 15.37 |
| 1904 | 13.90 |
| 1903 | 12.49 |
| 1902 | 14.81 |
| 1901 | 15.97 |
| 1900 | 12.81 |
| 1899 | 15.07 |
| 1898 | 15.23 |
| 1897 | 16.95 |
| 1896 | 18.57 |
| 1895 | 21.93 |
| 1894 | 21.72 |
| 1893 | 15.41 |
| 1892 | 15.59 |
| 1891 | 15.87 |
| 1890 | 17.88 |
| 1889 | 18.92 |
| 1888 | 17.18 |
| 1887 | 16.00 |
| 1886 | 17.76 |
| 1885 | 16.01 |
| 1884 | 13.51 |
| 1883 | 13.62 |
| 1882 | 13.58 |
| 1881 | 13.52 |
| 1880 | 11.89 |
| 1879 | 11.82 |
| 1878 | 11.08 |
| 1877 | 10.79 |
| 1876 | 12.81 |
| 1875 | 11.00 |
| 1874 | 9.94 |
| 1873 | 10.78 |
| 1872 | 12.09 |
| 1871 | 11.73 |
|

|
Click here for other historical returns.
|