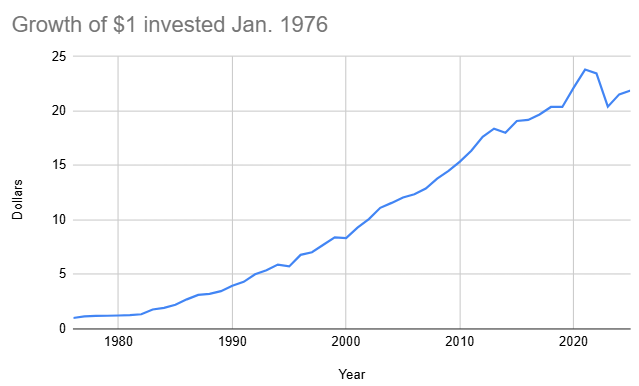
Summary
The Bloomberg US Aggregate Bond Index, formerly the Barclays Agg, is generally
considered the best US total bond market index.
It tracks bonds of investment-grade quality or better including government
Treasuries (about 40%), corporate bonds, mortgage-backed securities,
asset-backed securities, and munis.
Mean annual return (1976-present): 6.7%
Min/max annual return (1976-present): -13.0%/32.6%
Last 25 years mean annual return: 4.1%
Last 10 years mean annual return: 1.6%
Last 5 years mean annual return: 0.0%
Table of total yearly returns of the Blomberg US aggregate bond index
| Year | Return [%] |
|---|
| 2024 | 1.7 |
| 2023 | 5.5 |
| 2022 | -13.0 |
| 2021 | -1.5 |
| 2020 | 7.5 |
| 2019 | 8.7 |
| 2018 | 0.0 |
| 2017 | 3.5 |
| 2016 | 2.6 |
| 2015 | 0.5 |
| 2014 | 6.0 |
| 2013 | -2.0 |
| 2012 | 4.2 |
| 2011 | 7.8 |
| 2010 | 6.5 |
| 2009 | 5.9 |
| 2008 | 5.2 |
| 2007 | 7.0 |
| 2006 | 4.3 |
| 2005 | 2.4 |
| 2004 | 4.3 |
| 2003 | 4.1 |
| 2002 | 10.3 |
| 2001 | 8.4 |
| 2000 | 11.6 |
| 1999 | -0.8 |
| 1998 | 8.7 |
| 1997 | 9.7 |
| 1996 | 3.6 |
| 1995 | 18.5 |
| 1994 | -2.9 |
| 1993 | 9.8 |
| 1992 | 7.4 |
| 1991 | 16.0 |
| 1990 | 8.9 |
| 1989 | 14.5 |
| 1988 | 7.9 |
| 1987 | 2.7 |
| 1986 | 15.3 |
| 1985 | 22.1 |
| 1984 | 15.1 |
| 1983 | 8.4 |
| 1982 | 32.6 |
| 1981 | 6.2 |
| 1980 | 2.7 |
| 1979 | 1.9 |
| 1978 | 1.4 |
| 1977 | 3.0 |
| 1976 | 15.6 |
|
 --> -->
|
Click here for other historical returns.
|