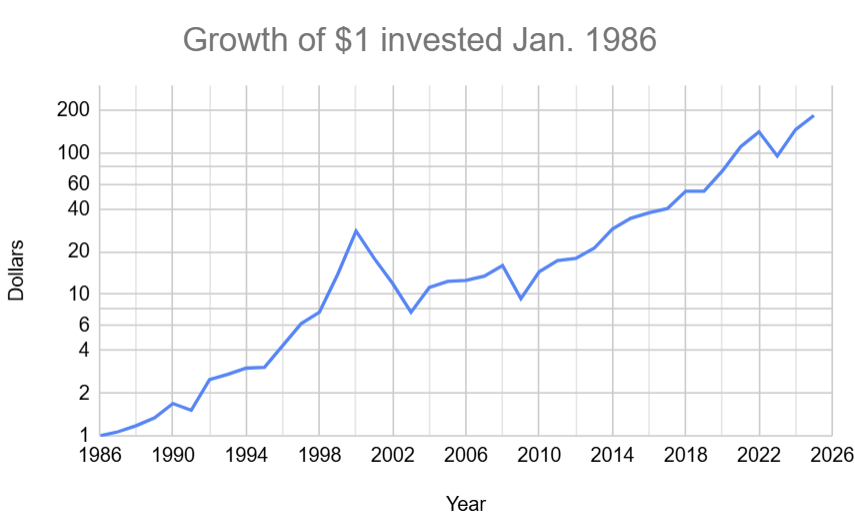
Summary
The Nasdaq-100 includes the 100 largest non-financial companies on the Nasdaq exchange.
The Nasdaq-100 index measures the cap-weighted returns of these stocks.
Investors can buy this index with ETFs like QQQ.
This index is often used to measure the performance of the tech market because
it has a high concentration in large tech companies such as Apple, Amazon and Google.
For more information about the NASDAQ read
"Nasdaq: A History of the Market That Changed the World."
Notable values for this index follow. Dividend reinvestment is assumed in
all values.
Entire history mean annual return: 18.7%
Entire history min/max annual return: -41.7/101.9%
Last 25 years mean annual return: 12.1%
Last 10 years mean annual return: 21.1%
Last 5 years mean annual return: 24.6%
Table of total annual returns of the Nasdaq-100 (includes dividends)
| Year | Return [%] |
|---|
| 2024 | 25.88 |
| 2023 | 53.81 |
| 2022 | -32.54 |
| 2021 | 27.42 |
| 2020 | 48.4 |
| 2019 | 38.96 |
| 2018 | -0.12 |
| 2017 | 32.66 |
| 2016 | 7.1 |
| 2015 | 9.45 |
| 2014 | 19.18 |
| 2013 | 36.63 |
| 2012 | 18.12 |
| 2011 | 3.47 |
| 2010 | 20.14 |
| 2009 | 54.68 |
| 2008 | -41.73 |
| 2007 | 19.02 |
| 2006 | 7.14 |
| 2005 | 1.57 |
| 2004 | 10.54 |
| 2003 | 49.67 |
| 2002 | -37.37 |
| 2001 | -33.34 |
| 2000 | -36.11 |
| 1999 | 101.95 |
| 1998 | 85.3 |
| 1997 | 20.63 |
| 1996 | 42.54 |
| 1995 | 42.54 |
| 1994 | 1.5 |
| 1993 | 10.58 |
| 1992 | 8.86 |
| 1991 | 64.99 |
| 1990 | -10.41 |
| 1989 | 26.17 |
| 1988 | 13.54 |
| 1987 | 10.5 |
| 1986 | 6.89 |
|

|
Click here for other historical returns.
|